Analytics
The Analytics page in Swytchcode gives you a clear, detailed view of how your projects and APIs are being used, helping you understand usage patterns, identify trends, and optimize your workflows. Visit https://app.swytchcode.com and visit Dashboard
Key Insights
Project Usage Overview
Track overall activity across your projects — from development to testing — with real-time metrics. See how frequently your APIs, workflows, and MCP connections are used.
Total MCP Connections
Monitor how many MCP (Method Control Protocol) connections have been made, giving you insight into how often your projects are being accessed through MCP-enabled tools.
Total API Calls
View the complete count of API requests made across all your projects, helping you gauge system load and usage trends over time.
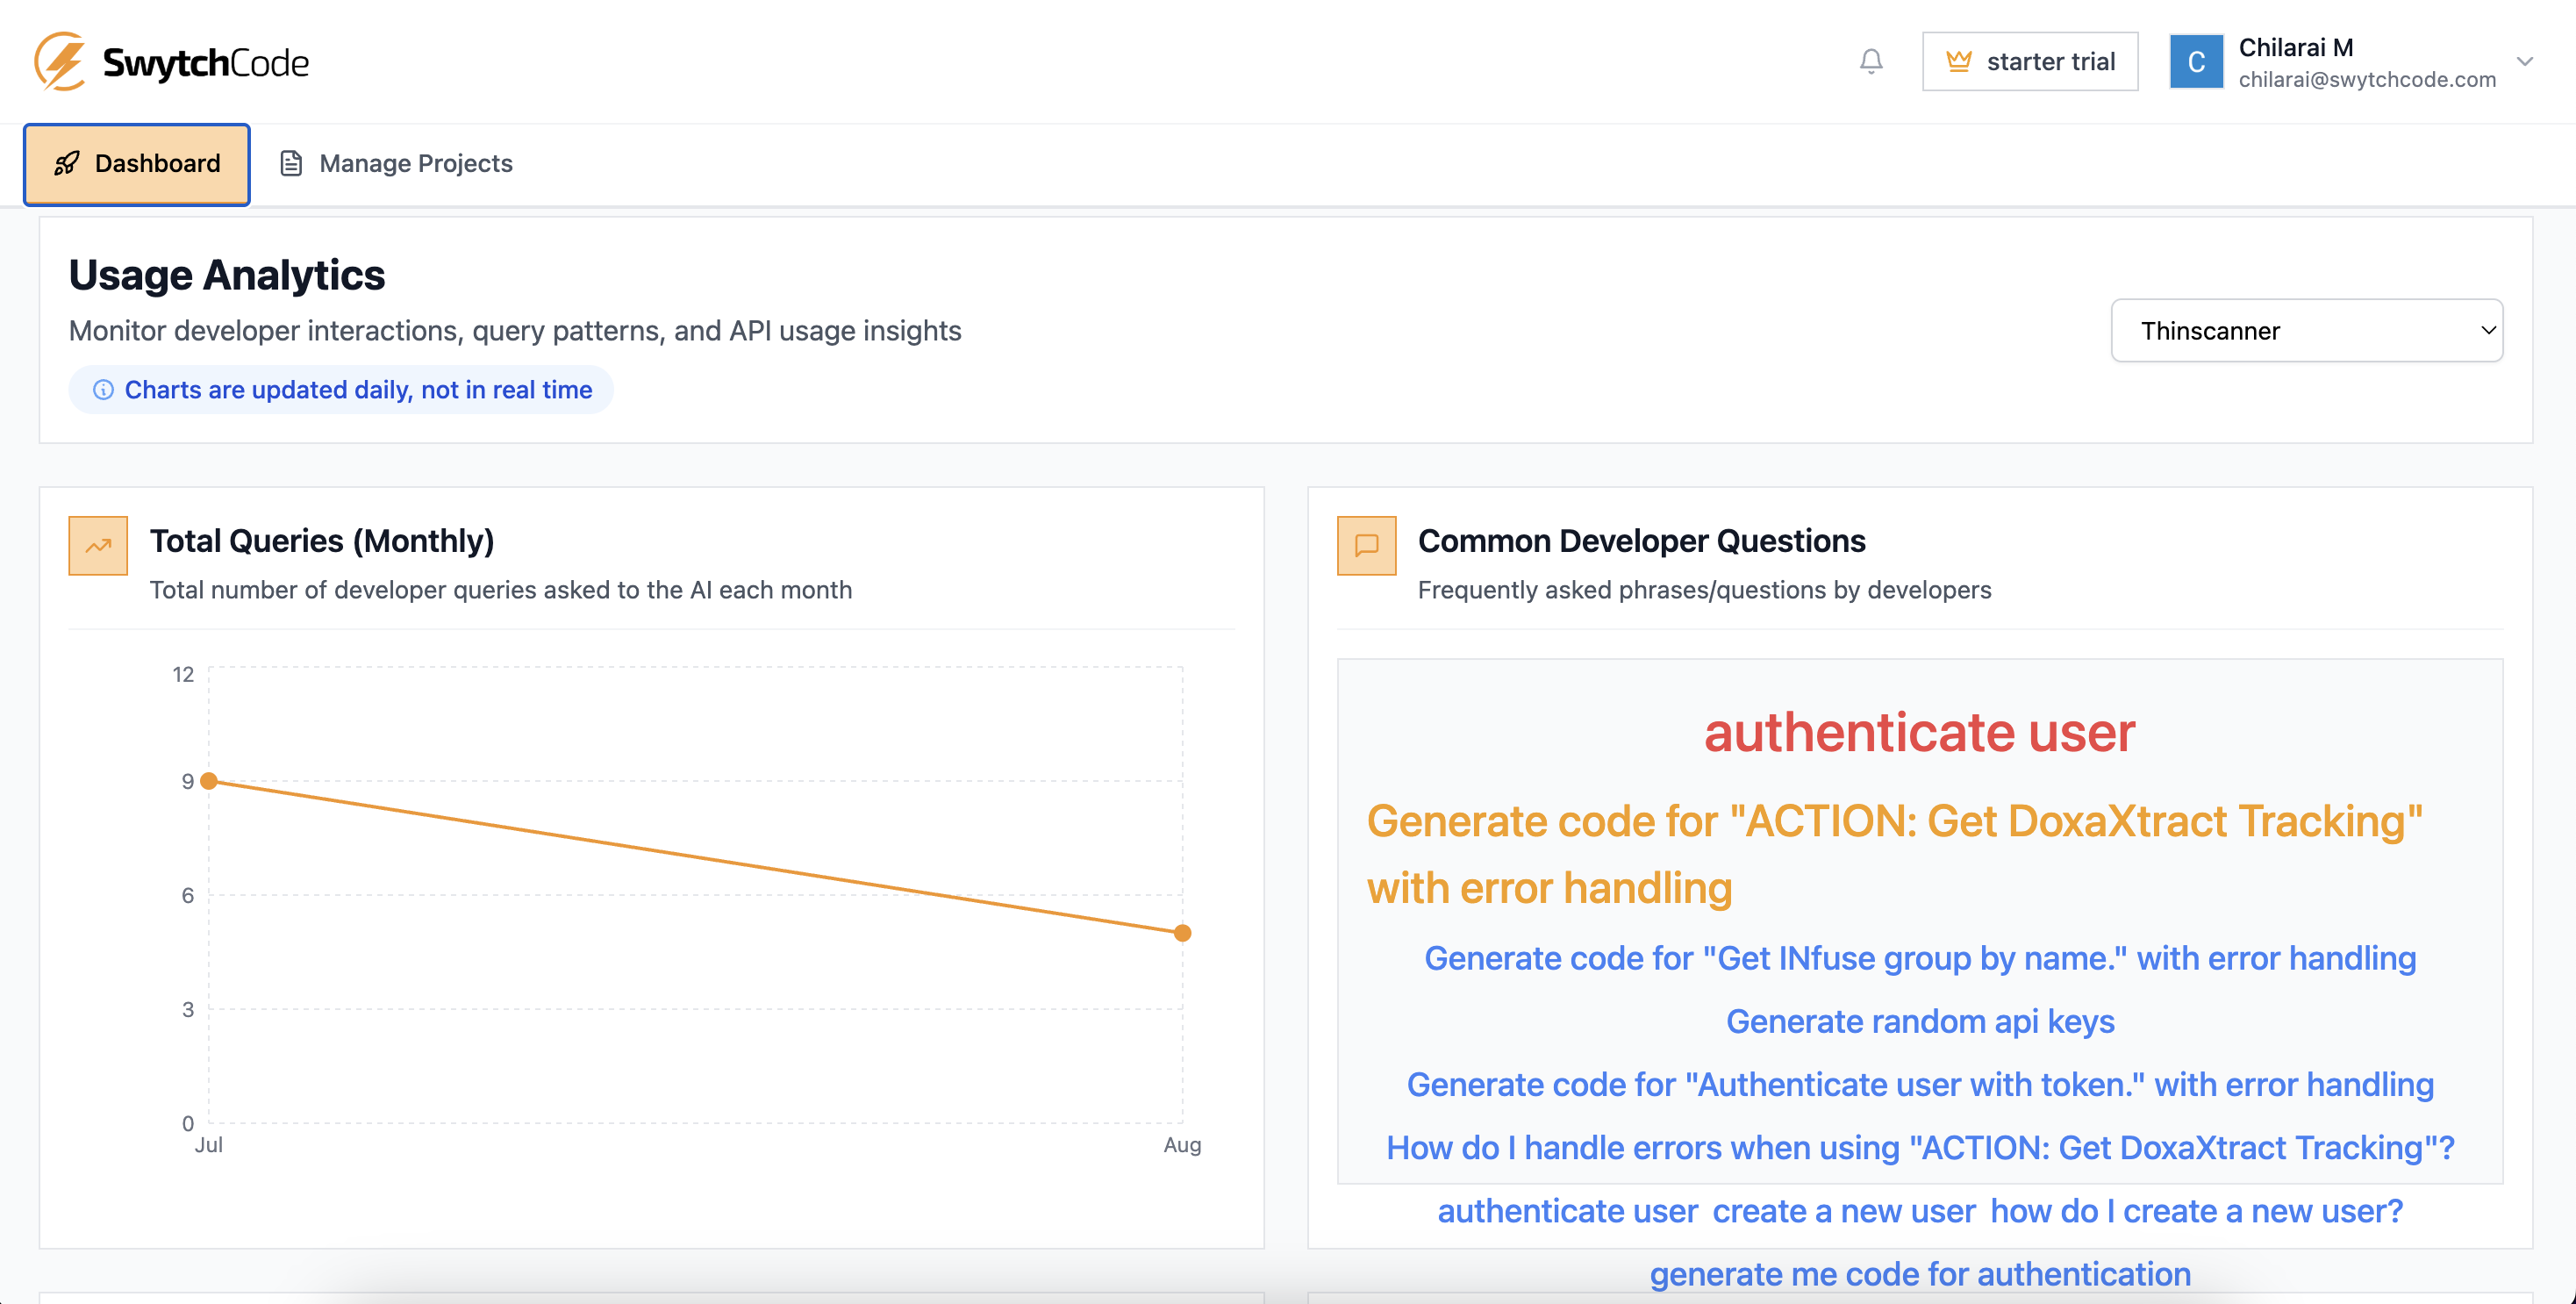
Most Called Prompts (Word Cloud)
Instantly see which prompts are used most often through an interactive word cloud. This helps you identify popular use cases and fine-tune your prompt library.
Top Endpoints & Workflows
Discover your most frequently called endpoints and workflows. This makes it easier to identify mission-critical API routes and optimize performance where it matters most.
Most Used Programming Languages
Get a breakdown of which programming languages are most commonly used with your APIs and SDKs. This insight can help guide documentation improvements, SDK updates, and targeted developer support.
Interactive Insights
All metrics are presented in an easy-to-read, visually engaging format — making it simple to spot spikes, trends, and anomalies.
By combining these metrics, Swytchcode Analytics helps you make data-driven decisions, improve API efficiency, and enhance the developer experience for your users.